We all recognize budget is a constant concern for auditors and investigators. Oftentimes our technology budgets are just too tight. We find ourselves looking for powerful tools to add to our toolbox that do not break the bank. One of these tools is Active Data for Excel. Active Data is an add-in for Excel that gives the user some of the powers of a data mining software without busting the budget. This is a great tool for performing data analytics.
I thought it might be helpful to share some of the features this product has to offer.
Split Columns
Separate contents of a column into multiple columns. Example: In the chart below assume you would like to separate the date into month, day and year.
Using the split column menu, select the column you would like to separate (Date) and then chose one of the options available. In this instance I have selected to split the year, month and day for date columns.
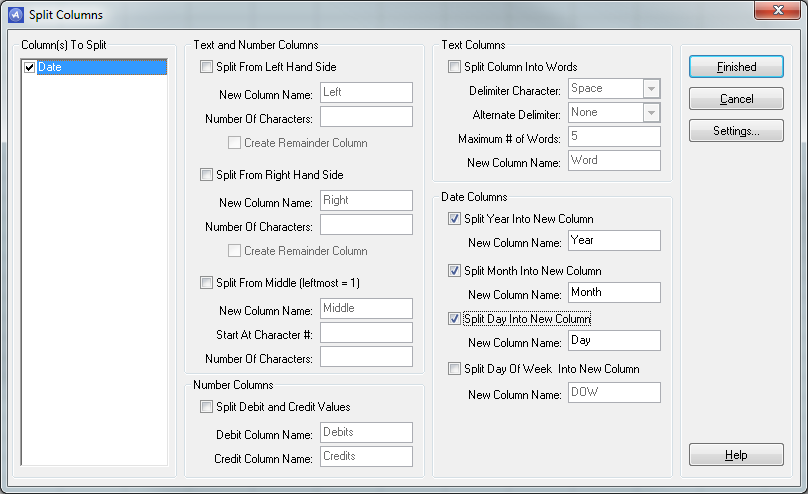
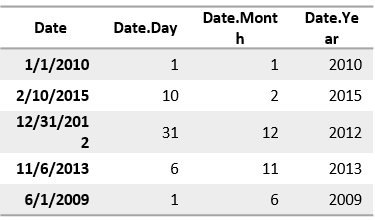
As you can see from the screen shot above, there are numerous options to split a column in addition to the date option. The result of the Split Column function is shown below.
Combine Columns
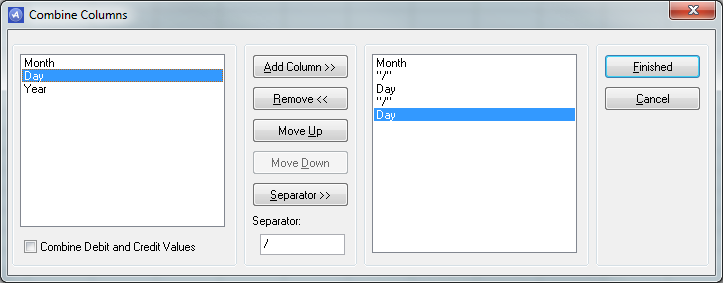
This performs the opposite of the Split Column function. For ease of illustration, I’ll use the dates from our previous example. When working in a file that has dates separated by month, day and year, you can combine them with a user defined separator.
Convert Selected Cells
This feature allows you to “clean” data in cells. For example, remove leading and trailing spaces, remove non-printing characters or even remove alpha or numeric characters from a specific cell.
Merge Sheets
Combine data from multiple worksheets based on a common field. For example: you have two worksheets with the following information:

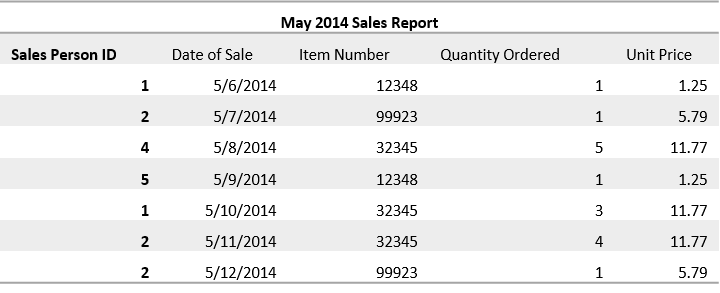
If you wanted to see the Sales Person Name in the May 2014 Sales Report, you could use the merge function and quickly have all information from Sales Person Master visible in the May 2014 Sales Report.
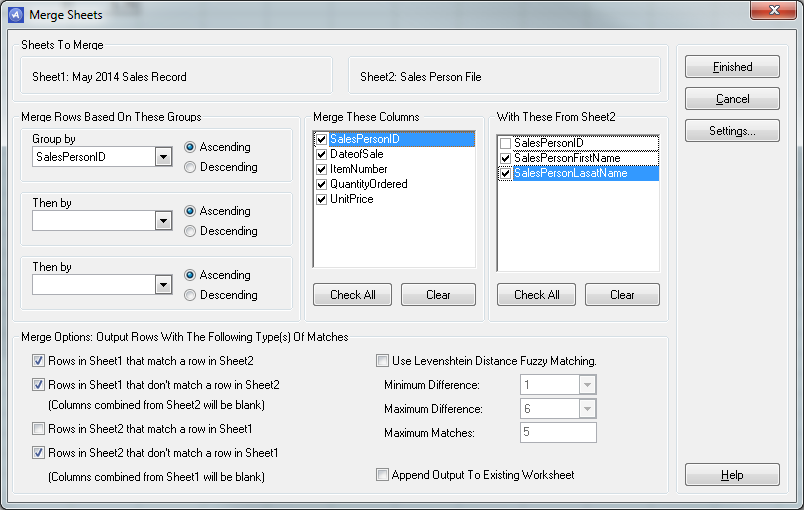
For this example I choose to merge the two worksheets on the Sales Person ID field and to include all columns for May 2014 Sales Report and all columns from Sales Person Master. I also chose to include all rows from May 2014 Sales Report and only those rows from Sales Person Master that do not match rows in May 2014 Sales Report. With this selection it will help me identify if there are any sales people who did not have sales in May 2014.
The results below show that all Sales Person names have been added, including those who did not have sales for the period under review.

Active Data also has more robust functions including the following:
Duplicates
Identifies duplicates in a selected column. Once identified, duplicates may be tagged, extracted or removed.
Gaps
Identifies Gaps in a selected column.
Digital Analysis
Identifies abnormally occurring digits that violate Benford’s Law. As shown in the image below, this tool allows for detailed customization. For example, below is a list of checks. I would like to determine if these amounts conform to Benford’s Law.
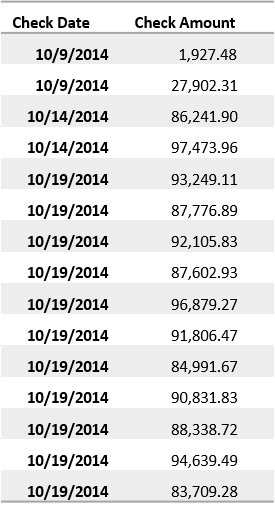
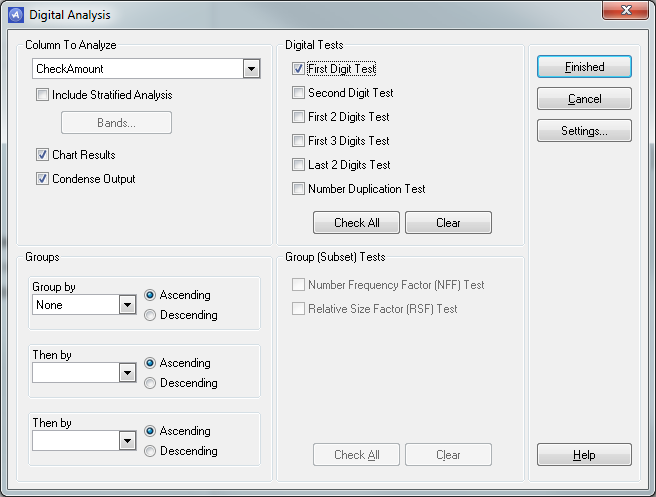
Using the digital analysis feature on the data above run a First Digit Test on the Check Amount.
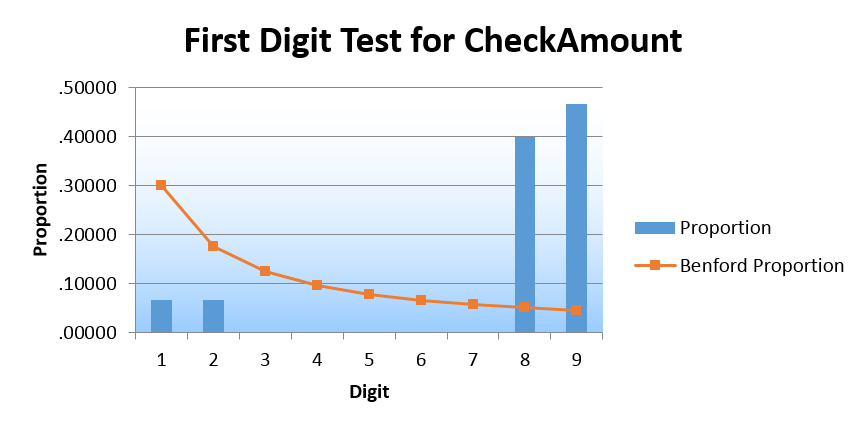
The results below indicate that further analysis is needed on those checks with beginning digits of 8 and 9 as these occurrences were greater than expected.
The items discussed above are just a few of the key features of Active Data that provide the Excel user with more power in an audit or investigation without busting the technology budget. A quick visit to www.informationactive.com provides a more detailed view of the functions available in this tool.

